

Configure Logstash, Elasticsearch, and Kibana with Docker


It was a long time ago I wanted to write this post and show you how to set up a docker-compose with all you need to have a separate logging system.
Logging is a meaningful way to monitor your application’s behavior. When it comes to production and having multiple servers running one application in different instances, You might want to have a unified logging system to check them all in one place.
So finally the day has come! In this post, I am going to show you how you can configure a docker server to have Logstash, Elasticsearch, and Kibana and will show you how you can use it with PHP, Laravel
Requirements
To get started you need to have a server. A VPS would be enough.
Then make sure you have installed git , docker and docker-compose.
Installation
Clone the repo from the Github repository
git clone https://github.com/saeedvaziry/elk.git
And then navigate to the folder
cd elk
Copy the .env file and fill it with your preferences
cp .env.example .env
The default .env should be enough but make sure you set a strong password to ELASTIC_PASSWORD inside the .env
Now you may run the following command to bring up the containers:
docker-compose up -d
This will download the images and boot up the containers and it may take a couple of minutes.
Add logging integration
After all of the containers are booted you can log in to Kibana.
Simply go to http://YOUR-SERVER-IP:5601 and log in via the Elastic credentials you have set in the .env file. If you’ve changed the Kibana port then you might navigate to that port instead of 5601.
Go to the integrations from the side menu and find the Custom UDP Logs


Add Custom UDP Logs and configure it as bellow
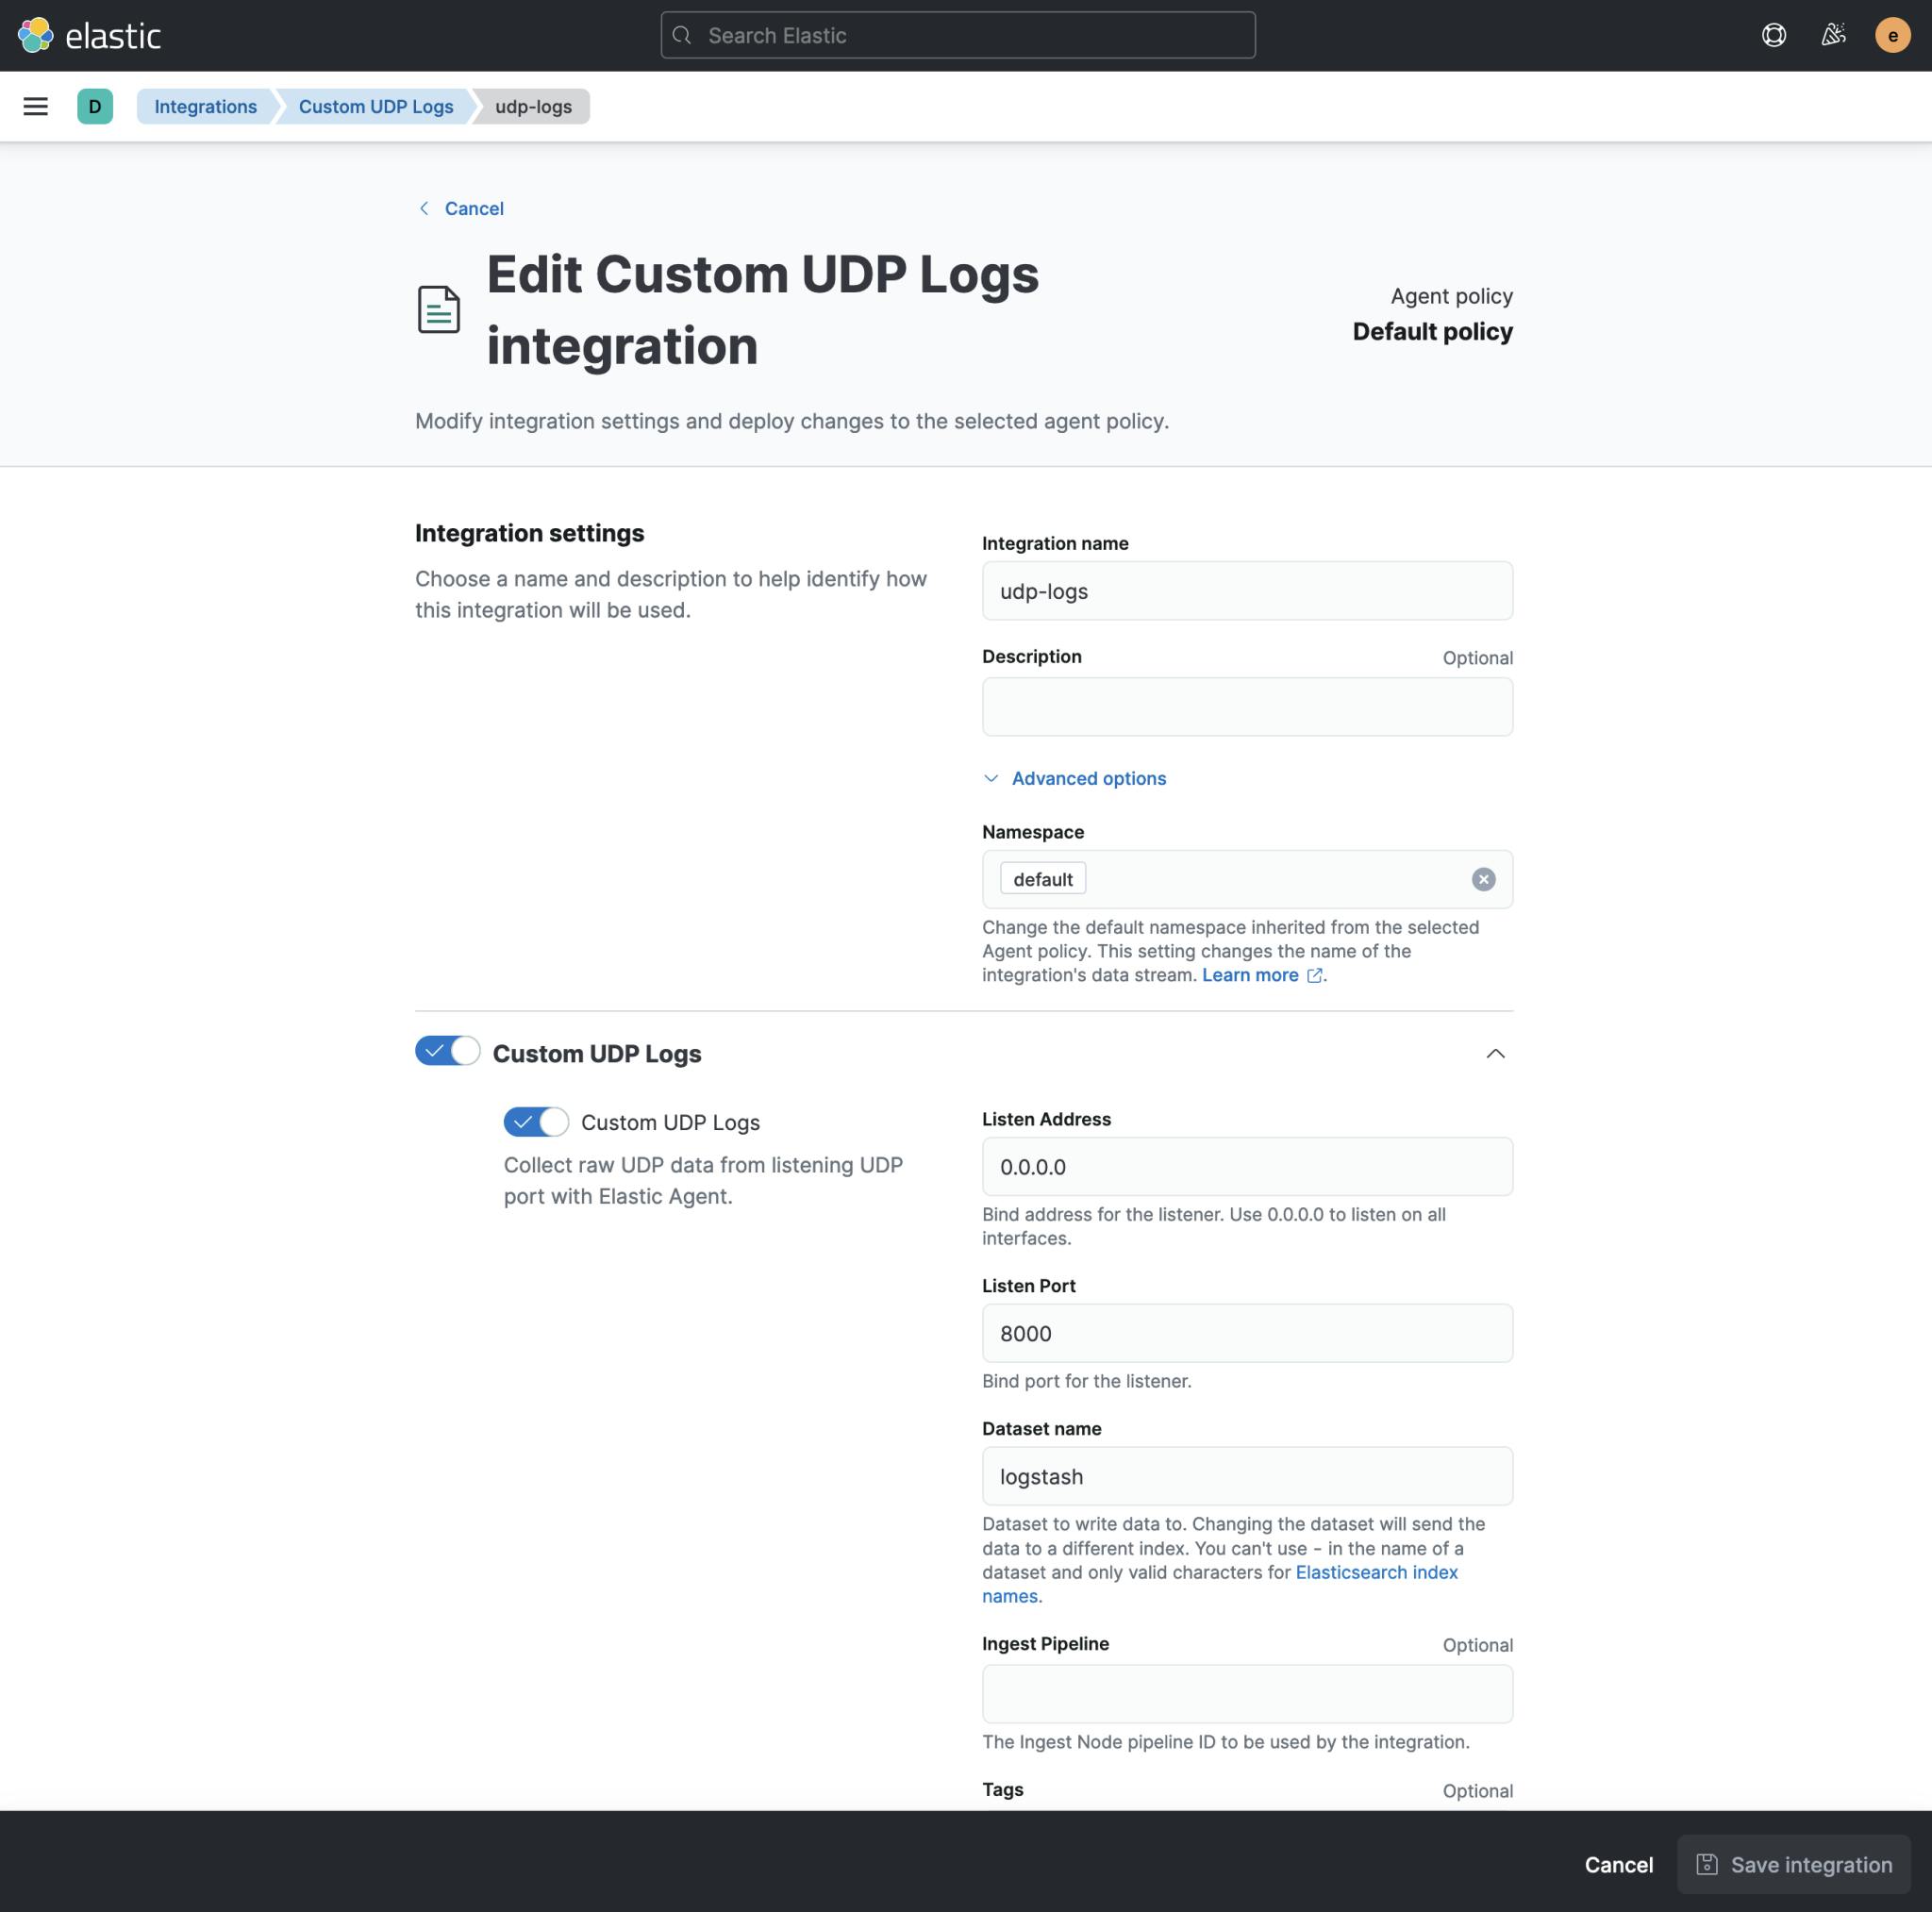
Then save the integration.
Keep in mind that Listen Port here is 8000 which is the one you specified in your .env as LOGSTASH_PORT_UDP
Configure index pattern
Go to Index Patterns and create an index pattern


Fill in the fields as the screenshot and Create it.
You are done here!
Send your first Log
Here is a sample PHP code so you can send your first log to Logstash
<?php

$socket = fsockopen('udp://YOUR-SERVER-IP', 8000, $errno, $errstr);
if (! $socket) {
    echo "ERROR: $errno - $errstr<br />\n";
} else {
    fwrite($socket, json_encode(['message' => 'Test log message']));
    fclose($socket);
}
View the Logs
After you run the code, You should be able to see the log in the Kibana on the Discovery menu.
Simply navigate to Discovery page of Kibana and select logstash-* pattern to view the logs you receive

Cool stuff 😎
Use Logstash in Laravel
OK! My favorite part 🙂
You don’t have much to do here actually. Just need to create a custom log driver and send the logs via that custom driver to Logstash.
Go to your config/logging.php file and create the custom driver there.
'logstash' => [
    'driver' => 'custom',
    'via' => \App\Loggers\Logstash::class,
    'host' => env('LOGSTASH_HOST', 'YOUR-SERVER-IP'),
    'port' => env('LOGSTASH_PORT', '8000'),
],
Now create \App\Loggers\Logstash::class and add the following code there
<?php

namespace App\Loggers;

use Monolog\Formatter\LogstashFormatter;
use Monolog\Handler\SocketHandler;
use Monolog\Logger;
use Monolog\Processor\WebProcessor;
use Psr\Log\LoggerInterface;

class Logstash
{
    public function __invoke(array $config): LoggerInterface
    {
        $handler = new SocketHandler("udp://{$config['host']}:{$config['port']}");
        $handler->setFormatter(new LogstashFormatter(config('app.name')));
        $handler->pushProcessor(new WebProcessor);

        return new Logger('logstash', [$handler]);
    }
}
All done! Now you may send your first log like this
Log::channel('logstash')->info('Hello from Laravel');
Final word
Logs are always handy, Don’t remove them from your applications 🙂
I hope you enjoyed the post. Let me know what you think about it.
See you in the next one!
Cheers 🍻